Real Estate Project Analytics: How Dashboards Improve Developer Decision-Making

For real estate developers and owners managing active construction pipelines, visibility is a performance lever. When budget updates live in spreadsheets, draw progress is tracked by email, and project pacing is hard to quantify, even well-capitalized teams struggle to answer a fundamental question: Is our capital being deployed effectively?
This is where centralized dashboards change the game. By transforming construction data into clear, actionable insights, owner and development teams can shift from reactive oversight to proactive, data-driven decisions. Modern real estate project analytics give professionals the control they need to protect returns, whether it’s understanding how long a draw is aging, where a project is falling behind, or how much interest reserve runway remains.
This article breaks down exactly how today’s leading developers are using project analytics tools to optimize capital flow, reduce risk, and unlock better outcomes across the full development lifecycle.
Real-Time Construction Analytics in Housing Project Management
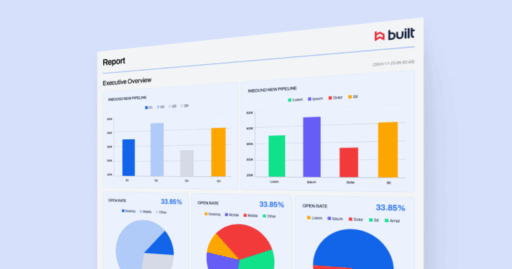
Modern reporting gives development teams and property owners the visibility they need to manage capital with precision. It connects draw schedules, budget performance, inspections, and risk indicators into one structured view. Instead of spending time reconciling data across spreadsheets and disconnected systems, real estate professionals can focus on what is moving, what is stalled, and what needs attention.
By enabling data-driven decisions and surfacing actionable insights, real-time reporting turns static data into a strategic tool. Teams can make faster, smarter decisions that keep projects on track, reduce extra costs, and improve overall portfolio performance.
Stop managing risk in spreadsheets. Get real-time portfolio oversight with Built’s Asset Management Suite.
Data Foundation: Essential Inputs for Portfolio Analytics
Effective portfolio oversight begins with consistently structured, high-integrity data from construction workflows, capital reporting, market research tools, and project progress tracking. For owners and real estate professionals managing active development pipelines, visibility alone isn’t enough.
True control comes from connected, real-time insights that enable data-driven decisions, support capital management, mitigate risk, and enhance project performance. The following eight data inputs form the foundation for smarter investments and better outcomes across the portfolio.
- Draw Performance Data Tracking the status and timing of draw requests reveals how quickly capital is moving through the system. Real-time draw aging reports, approval delays, and exception flags allow teams to anticipate cash flow disruptions and respond before they impact timelines or lender relationships. Proactive draw tracking also improves capital forecasting and liquidity planning by surfacing funding friction points early.
- Inspection Progress and Pacing Metrics Monitoring actual inspection completion against baseline schedules allows teams to detect slippage early. When delays surface in field inspection workflows, they often foreshadow broader timeline risks. Integrating inspection data from field apps or project management systems enables more accurate schedule forecasting and proactive mitigation.
- Budget Line Item Tracking and Change Order Analysis Detailed tracking of budget line items, coupled with real-time visibility into change orders, enables developers to see the true cost impact of field decisions. This level of granularity strengthens cost control and prevents surprise overruns. Digital tools that update budgets in real time help teams maintain alignment between field execution and financial planning.
- Interest Reserve Burn and Sufficiency Views Forecasting interest reserve usage is essential for ensuring adequate coverage throughout construction. Real-time burn tracking helps owners avoid shortfalls that could stall disbursements or trigger additional equity requirements. Platforms that integrate funding schedules with reserve data enable more confident risk planning.
- Overdraw and Maturity Risk Flags Automated alerts that flag projects approaching or exceeding budget ceilings or completion dates help teams intervene before non-compliance jeopardizes capital access or project viability. These controls support proactive portfolio oversight, especially when scaled across dozens or hundreds of loans.
- GC and Vendor Performance Indicators Metrics such as documentation accuracy, inspection turnaround time, and SLA adherence give owners the data necessary to evaluate contractor reliability. Benchmarking these KPIs across projects supports vendor accountability, improves scheduling predictability, and reduces admin rework caused by incomplete or late submissions.
- Funding Source Status Breakdown Understanding how funding is being drawn down from equity versus debt sources provides visibility into capital pacing. Real-time insight into funding source mix helps project teams align liquidity planning with draw schedules and ensures compliance with financing covenants.
- Portfolio Exposure Insights Aggregating data by region, general contractor, or asset type highlights overconcentration risks. These views help development leaders rebalance exposure and prioritize capital deployment to the most resilient or strategic opportunities. When paired with predictive modeling, portfolio analytics can simulate how risks compound across market or vendor tiers.
When these inputs are centralized in a unified analytics platform, owners and developers move from fragmented oversight to strategic control. Standardized, real-time data removes blind spots, reduces lag in decision-making, and powers proactive management across both project and portfolio levels. Clean, contextualized inputs are the engine of any performance-driven development strategy.
Leveraging Portfolio Oversight for Smarter Capital Planning
Analytics platforms give development teams the operational edge to act earlier, allocate smarter, and manage risk with discipline. The following use cases illustrate how structured reporting supports execution across development and asset management functions, directly supporting portfolio-level capital planning.
Draw and Funding Oversight
Capital that moves too slowly creates downstream problems, like missed payment windows, contractor delays, and strained lender relationships. Analytics platforms help track how long each draw takes from submission to disbursement, flag approval bottlenecks, and identify where workflows stall. With this data, teams can intervene early, reduce turnaround times, and improve alignment between funding and field progress.
Operational impact:
- Shortens draw cycles by removing administrative delays
- Increases draw-to-work alignment, preventing liquidity gaps
- Enhances lender accountability through benchmarked performance
- Improves forecasting accuracy by overlaying construction cost data with regional market trends and historical pricing analysis.
Example: A regional developer used draw analytics to isolate delays tied to third-party inspections. By streamlining documentation handoffs, they reduced draw processing times by over 50%, accelerating payments to vendors and unlocking interest income sooner.
Budget Performance Tracking
Construction budgets are highly dynamic. Without visibility into change orders and cost-to-progress ratios, even well-run projects can drift into overrun territory. Project analytics enables teams to monitor every budget line item in real time, assess the cumulative impact of scope changes, and track whether current spending is justified by work completed.
Operational impact:
- Improves cost forecasting by identifying variance trends early
- Prevents budget creep by tying spend to validated field progress
- Helps recover from overruns through scenario modeling and reallocation
Example: One developer surfaced a trend of repeated unapproved change orders across mechanical scopes. Analytics helped quantify the issue before it reached procurement, saving $400,000 on a $30 million build.
Portfolio-Level Risk Monitoring
At scale, portfolio-level oversight requires more than static dashboards. Real-time analytics surfaces which assets are overdrawn, which projects are behind schedule, and which general contractors consistently underperform. This enables asset managers to prioritize interventions based on data, not intuition.
Operational impact:
- Supports capital planning by surfacing funding and performance risk
- Improves contractor management with historical KPI comparisons
- Identifies systemic issues across regions or asset types
Example: An institutional investor used predictive analytics to identify that three projects, spread across two states, were likely to miss their targeted completion dates due to consistent inspection delays. They redirected resources and renegotiated terms to protect delivery timelines.
Compliance and Audit Readiness
Draw approvals, field inspections, and documentation requirements create a heavy paper trail. Analytics systems consolidate these records automatically, maintaining clean audit trails and enforcing internal policy compliance. Instead of preparing for audits reactively, teams can meet requests immediately with system-generated logs.
Operational impact:
- Reduces audit prep time by keeping all records centralized and accessible
- Ensures policy adherence across teams, lenders, and contractors
- Decreases administrative overhead related to compliance reviews
Example: A private equity-backed developer undergoing quarterly fund audits reduced their document preparation time by 70% after adopting an analytics platform that automatically logged draw approvals, inspection results, and lender interactions.
Stakeholder Coordination
Misalignment between owners, lenders, and GCs often stems from fragmented information. An analytic platform can create a shared source of truth that reflects real-time status across all project dimensions. Whether in owner-architect-contractor (OAC) meetings or investor briefings, stakeholders can align decisions around up-to-date, contextualized data.
Operational impact:
- Enables transparent progress reporting to investors and partners
- Reduces friction between contractors and owners through visibility
- Enhances trust with lenders via real-time compliance tracking
Example: A multi-phase development team cut their weekly coordination call from 90 minutes to 45 by using a shared dashboard that replaced six disconnected reports and eliminated debate over data accuracy.
The Real Estate Reporting Platform Built for Owners and Developers
Most PropTech platforms are designed for stabilized assets, with features focused on tenant data, valuations, or post-development investment modeling. Built takes a different approach. It was purpose-built for owners and developers navigating the complexity of active construction projects.
Rather than retrofitting general business tools, Built delivers real-time visibility into draw progress, compliance risk, capital pacing, and funding velocity. The platform acts as a centralized, audit-ready reporting hub that supports both day-to-day operations and long-term portfolio strategy.
Today, Built tracks more than $250 billion in project value across 86,000 active construction projects. Its architecture reflects the unique demands of development-stage workflows, with features like automated draw management, real-time budget tracking, inspection pacing, and risk flagging baked in from the start.
The difference becomes clear as portfolios scale. Owners managing projects across markets, lenders, and general contractors use Built to unify data streams into live dashboards. These dashboards let teams monitor individual asset performance and surface portfolio-wide trends without delay or manual reconciliation.
Customers report faster funding cycles, cleaner compliance records, and fewer hours spent wrangling spreadsheets. Many teams cut time-to-insight by 80 percent after switching to Built, unlocking capacity for higher-value work like sourcing new deals, rebalancing capital, or refining strategy.
Implementation Best Practices for Real-Time Construction Analytics
Implementing real-time reporting takes more than installing software. Owners and developers gain the most value when data is centralized, teams are aligned on process, and reporting is built into daily workflows. These steps help ensure your system delivers faster decisions and stronger outcomes, not just another dashboard.
- Centralize Your Project Data by consolidating budget, draw, inspection, and compliance information into a single platform to eliminate silos and duplicative systems. This foundational step enables the comprehensive analysis that drives better decision-making.
- Focus on Stakeholder Enablement through training owners, lenders, and general contractors on shared workflows to ensure alignment and minimize delays. Change management proves critical for realizing the full benefits of new systems.
- Standardize Reporting Cadences by defining weekly or monthly reporting rhythms at both project and portfolio levels. Consistent timing ensures stakeholders can plan around data availability and maintains accountability for performance metrics.
- Assign a Reporting Champion within the organization to own compliance tracking, risk alerts, and executive reporting output. This dedicated resource helps bridge the gap between technology capabilities and business processes.
- Measure ROI Early by monitoring improvements in draw turnaround, risk visibility, and portfolio management efficiency post-implementation. Quick wins help build momentum and stakeholder buy-in for expanded use of analytics capabilities.
Companies that follow these implementation strategies typically see faster time-to-value and higher user adoption rates. The key lies in treating analytics implementation as a business process improvement initiative rather than simply a technology deployment.
The Role of Custom Analytics in Housing Scheme Viability
As construction finance becomes increasingly data-driven, new technologies are expanding what’s possible across the development lifecycle, directly supporting the viability analysis of housing schemes.
AI-Powered Forecasting and Predictive Modeling
Advanced analytics platforms are evolving from descriptive dashboards to predictive tools. AI models can surface early warnings about budget overruns, timeline slippage, or documentation bottlenecks, helping teams intervene before issues escalate. Many Built users already benefit from this kind of risk flagging and draw pacing analysis.
Integration with Market and Demographic Data
Combining project-level data with external datasets, like local absorption trends, demographic shifts, and regional cost benchmarks, enables smarter decisions around site selection, pricing, and investment timing. This type of insight supports better underwriting and portfolio strategy, especially at the institutional level.
IoT and Sensor-Based Progress Tracking (Emerging)
As jobsite technology advances, sensors and IoT devices may soon feed real-time data into reporting platforms, tracking everything from material deliveries to on-site inspections. While still early-stage in vertical construction, this trend could provide more granular visibility into field progress and delay risks.
ESG and Sustainability Metrics (Gaining Momentum)
Environmental and social governance (ESG) factors are becoming more relevant for lenders, investors, and large developers. Future analytics platforms may incorporate carbon impact, energy performance, and DEI metrics into capital planning, aligning project execution with broader stakeholder values.
Blockchain for Transparent Audit Trails (Exploratory)
Blockchain’s potential for tamper-proof documentation and immutable audit trails offers appeal in compliance-heavy environments. Though adoption in construction finance remains limited today, its transparency and security benefits could gain traction for high-stakes lending and equity partnerships.
Real-Time Insights Are No Longer Optional
Real estate development is complex, but visibility shouldn’t be. When capital is on the line, property owners and real estate professionals need more than static spreadsheets and siloed updates. They need real-time, data-driven insights that support smarter decisions at every stage of the development lifecycle.
That’s where Built delivers value. Purpose-built for construction finance, the platform enables teams to unify project data, streamline reporting, and manage portfolio performance with precision. From capital pacing to risk monitoring, Built gives stakeholders the tools they need to move faster and protect returns.
With structured analytics in place, developers stop reacting to problems and start steering outcomes. The result is better-aligned teams, tighter financial control, and a real estate portfolio that performs across every phase. Book your demo with Built today.
Modern Reporting FAQs for Owners and Developers
How do dashboards improve decision-making for real estate developers?
Dashboards centralize disparate data (budgets, schedules, draw requests) into a single visual source. This real-time visibility replaces manual reporting, allowing developers to spot and mitigate risk immediately, optimizing capital allocation.
How does analytics support capital planning in real estate portfolios?
Portfolio-level analytics provide a holistic view of asset performance, cash flow projections, and risk exposure across all projects. This data allows stakeholders to compare potential returns and strategically plan capital deployment over a 3-5 year horizon.
What are the advantages of real-time analytics in housing project management?
Real-time analytics eliminate delays inherent in monthly reporting cycles. Advantages include immediate cost overrun alerts, faster invoice approvals, and the ability to proactively reallocate resources to keep housing projects on budget and on schedule.

Mark Murphy leads OGC Sales at Built, where he is responsible for accelerating adoption of payments and standalone solutions purpose-built for real estate owners, developers, and general contractors. He brings deep experience across sales, general management, and operations in technology-driven businesses.
Prior to joining Built, Mark served as General Manager at Apex Service Partners and Operating Executive at Alpine Investors. He also spent over six years at Flexport, where he held multiple leadership roles including General Manager for the South and Northeast regions, and Director & Acting General Manager for San Francisco and Northern California. Earlier in his career, Mark was Chief Operating Officer at Oolong, an INC 500-recognized international trading business.
Mark holds a degree in Mechanical Engineering from Stanford University, where he captained the Varsity Men’s Rowing team.
Related Posts
Best Construction Project Tracking and Financial Software for Owner-Developers (2026)
