Proactive Portfolio Management: A Deep Dive into Built’s Four Core Risk Dashboards

Construction lending is a complex and high-stakes sector. It demands constant vigilance over project data, resource management, and capital allocation to maintain portfolio performance and reduce exposure.
Without real-time visibility, even minor issues can escalate into substantial risk, jeopardizing returns, investor confidence, and loan performance.
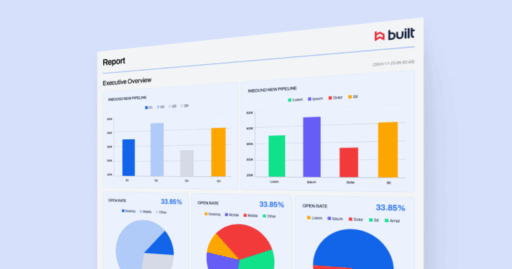
Built’s risk dashboard suite provides a single source of truth for financial institutions, offering real-time insights that empower lenders to shift from reactive oversight to a proactive approach. With these tools, teams can identify potential issues early, support informed decision-making, and strengthen portfolio monitoring efforts.
This article explores how to maximize the value of Built’s reporting capabilities,from core navigation tips to a deep dive into the platform’s four most essential dashboards for risk management, compliance, and growth.
Reporting Fundamentals and Viewer Best Practices
Built’s reporting module offers two standard formats: Tabular Reports (like Excel grids for raw data drill-down) and Dashboards (visual summaries that surface broad trends).
To become a proactive portfolio manager, adopt these simple-yet-powerful habits:
- Master the filters and bookmarks: Every report includes filters (by region, group, stakeholder, or date) allowing you to drill down to the required data level. If you frequently use the same filtered view (e.g., for weekly branch reviews), save it as a bookmark. Bookmarks are personal, user-specific views that allow instant access to your preferred filtered view.
- The power of interaction: All dashboards are interactive. Clicking a visual (e.g., a bar representing 12 stalled projects) will automatically drill down to the underlying project level data. This seamless link transforms the report from a mere snapshot into an actionable workflow, allowing you to move directly from insight to action.
Reset is your friend: When testing filters or navigating deep into metrics, the reset button instantly returns the report to its default, clean state, saving you the time of manually deselecting multiple criteria.
In-Depth Look: Four High-Impact Dashboards
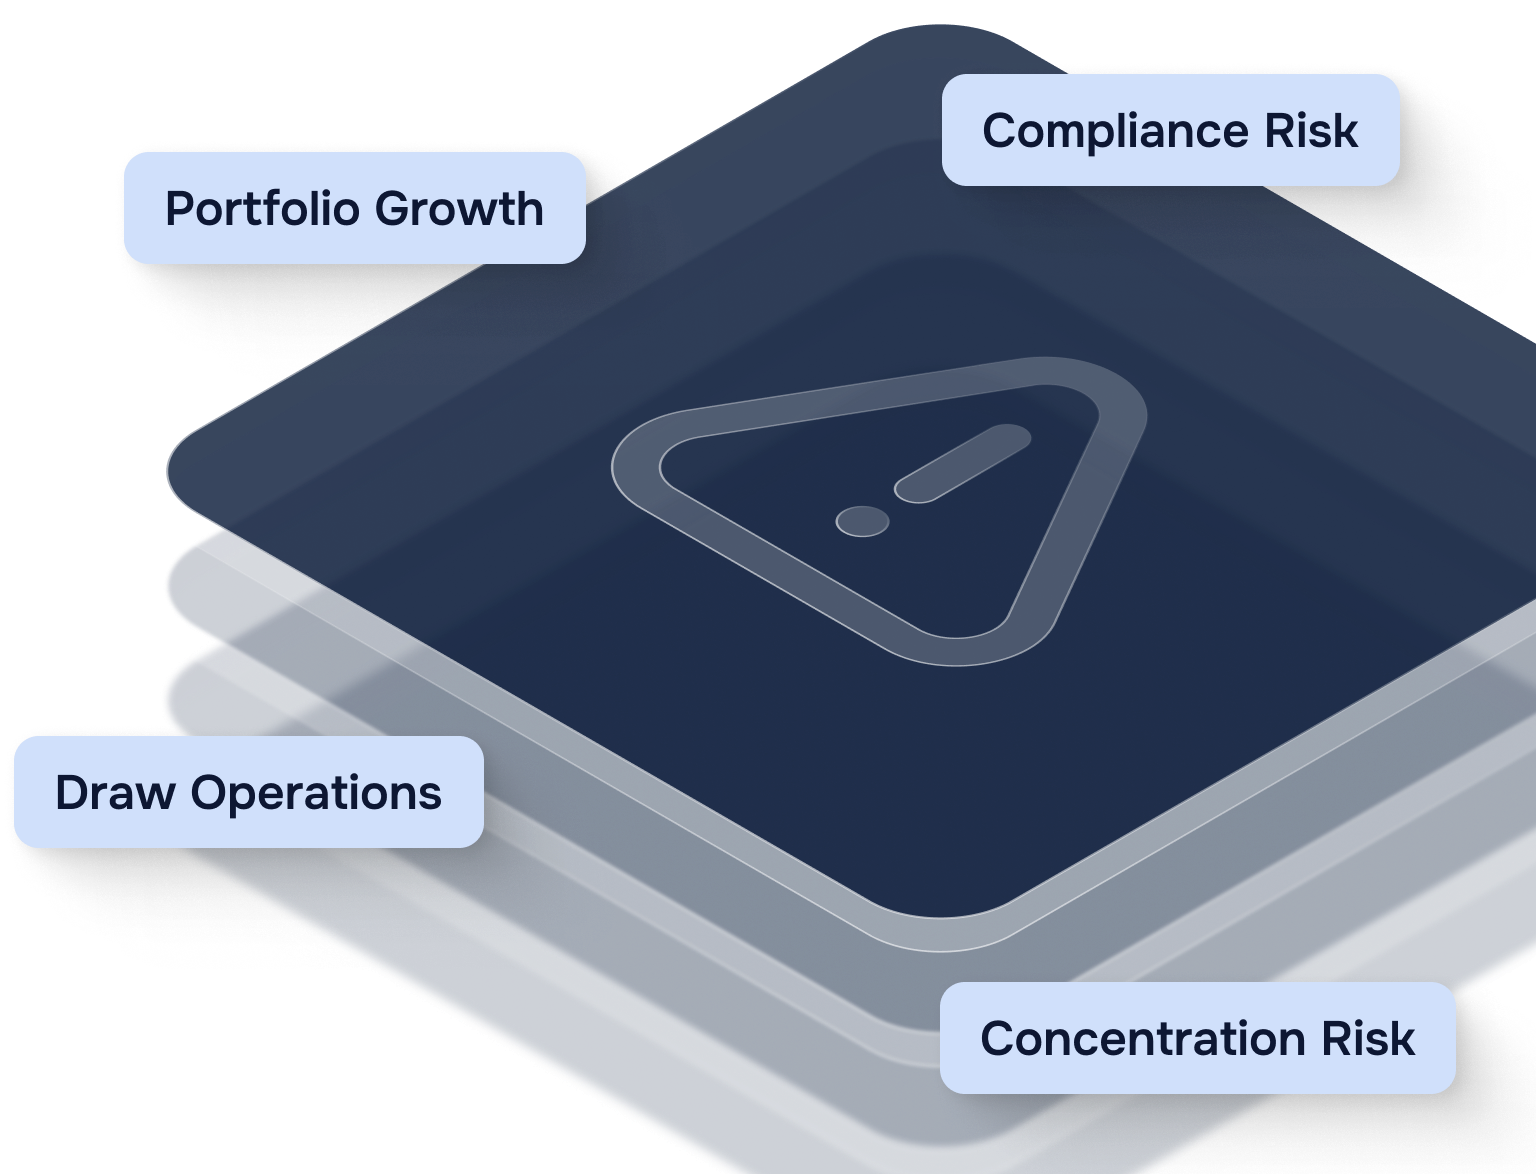
| Dashboard | Primary Use Case | Key Value |
| Compliance Risk | Real-time alerts on at-risk projects | Early risk mitigation |
| Concentration Risk | Monitor exposure by borrower, asset, geography | Enforce lending limits |
| Draw Operations | Track draw volumes and timing | Increase processing speed |
| Portfolio Growth | Forecast capital deployment | Strategic planning |
While real-time data power every report, these four dashboards consistently drive the most value for construction lenders:
1. Compliance risk dashboard: your early detection system
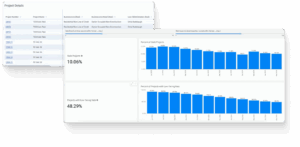
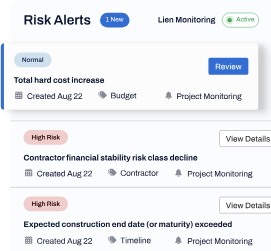
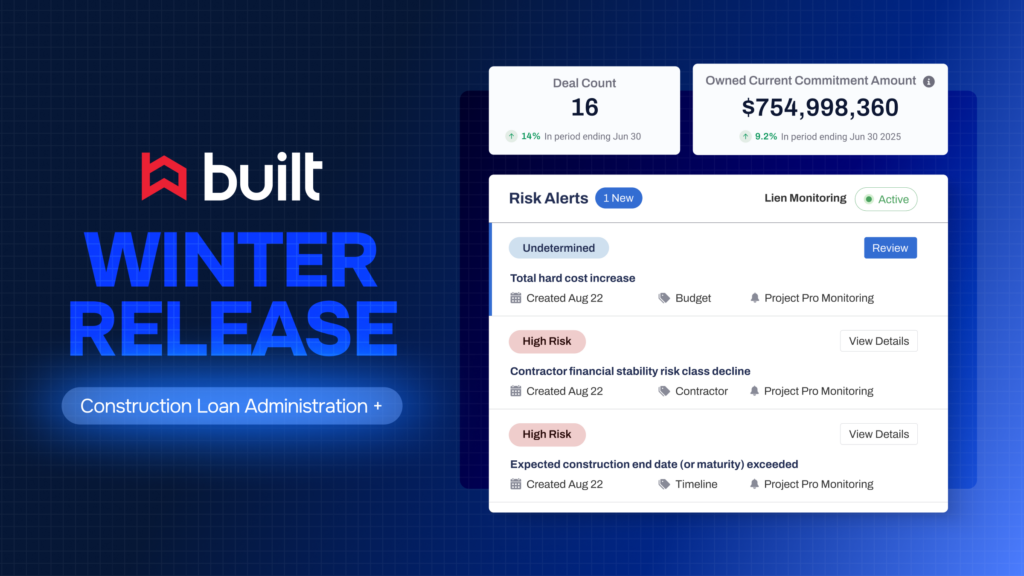
This dashboard is operationally critical, providing a holistic view of portfolio and project-level compliance. It functions as an early warning system, surfacing projects with the following characteristics:
- Overdrawn or overfunded
- Past maturity
- Stale (no draw or inspection activity within a set timeframe)
- Lacking sufficient interest reserve
Key feature
You can define your own thresholds. For instance, you can set “stale” to mean no activity in 30, 45, or 60 days, ensuring the metrics align precisely with your institution’s risk tolerance.
The dashboard’s lower half provides direct project-level hyperlinks for immediate action or escalation.
Why it matters
The compliance risk dashboard is the foundation for proactive risk mitigation. With delinquency rates in non-owner-occupied CRE reaching in Q2 2024 for banks with over $100 billion in assets (according to S&P Global), the ability to surface stale projects, underfunded reserves, or inspection gaps in real time is critical.
These early signals often precede larger breakdowns in project performance or borrower compliance. By embedding thresholds and alerts directly into the workflow, institutions can act before risk escalates, preserving portfolio health and strengthening internal oversight at a time when scrutiny is increasing.
2. Concentration risk dashboard: the strategic view
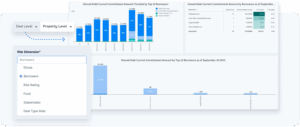
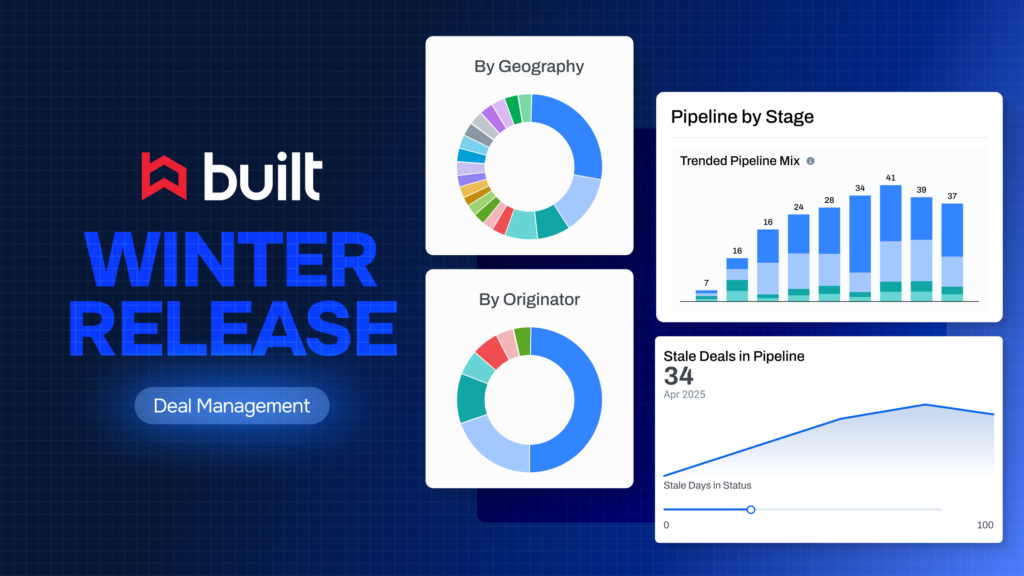
Designed for credit policy and long-term risk management, this dashboard helps you understand the distribution of your lending activity. It supports smarter capital allocation and enforces credit discipline by monitoring exposure across multiple dimensions:
- Borrower and general contractor exposure
- Business line and property type distribution
- Geography (State or MSA)
Regulatory Context
This view is essential for meeting supervisory expectations outlined by the FDIC, Federal Reserve, and OCC. According to joint regulatory guidance, a bank may face significant CRE concentration risk if the following occur:
- Total CRE loans exceed 300% of the institution’s total capital
- Construction loans exceed 100% of total risk-based capital
These thresholds are not hard limits, but they trigger heightened regulatory scrutiny and require robust concentration tracking and risk management practices.
The concentration dashboard enables institutions to stay within internal lending limits and quickly assess portfolio impact from external shocks, such as a major general contractor becoming unavailable.
3. Draw operations dashboard: tracking efficiency
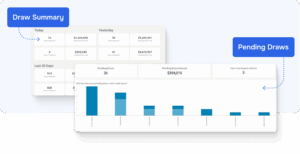
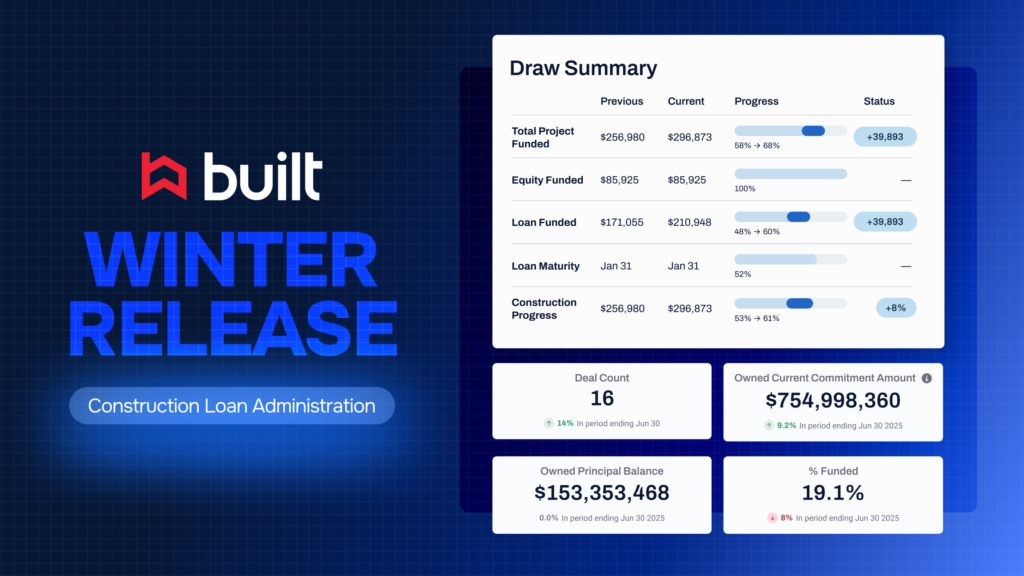
A favorite among loan admin teams, this dashboard answers the critical question: What is happening in draw processing today? It surfaces key operational metrics:
- Same-day draw totals and monthly trends
- Pending draws broken down by Loan Admin and age for prioritization
- Average processing times (Industry averages suggest 3-5 days for residential and 5-7 days for commercial)
Key feature
The dashboard also helps track adoption, showing how often builders and borrowers submit requests directly through Built versus external channels. High adoption rates are closely tied to better turnaround times and data integrity.
(Note: All data refreshes every two hours during business hours, resulting in a typical 2-4 hour lag window.)
Efficiency impact
Streamlining draw ops is a competitive edge, directly improving turnaround time and borrower satisfaction.
For lenders and builders using platforms like Built to digitally request and manage draws, the average draw completion time can drop significantly (in some cases, to days), emphasizing the value of moving away from manual, paper-based workflows.
4. Portfolio growth dashboard: forecasting capital
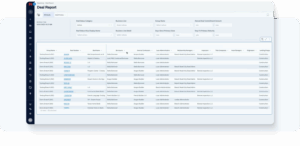
An essential tool for strategic planning, this report provides a time-based view of your portfolio’s evolution. It tracks trends in deal activations, closings, and overall funding volume across various attributes.
- Deal growth tab: Summarizes active deals, commitment dollars, and funds dispersed. Toggles allow you to filter for only your institution’s owned balances (excluding syndicated loans) and customize funding source classifications.
- Property cuts tab: Breaks down commitment data at the property level, offering a more nuanced view of capital distribution by asset class (e.g., multifamily, industrial) and market geography.
Extending Impact: Automation, Alerts, and Custom Reporting
Built dashboards are dynamic systems designed to automate visibility and enable proactive notification.
Automation and alerts
- Scheduled exports: Eliminate manual steps by scheduling any report to be delivered automatically (daily, weekly, or monthly) to your inbox or to external recipients (who do not need to be Built users).
- Email burst: This powerful feature allows you to send a single report to multiple recipients, but with row-level filtering applied. For example, a national lead can send one report, but each regional admin only sees their specific branch data, ensuring clean and secure distribution.
- Alerts: Set up conditional logic to define triggers based on report elements. For instance, create an alert to notify a credit officer when more than five projects go stale, or when a pending draw exceeds a 10-day limit.
Taking reporting further
For organizations with specialized board reporting needs, unique investment strategies, or advanced business logic, Built’s platform offers flexible ways to go beyond default dashboards.
- Creator license: This unlocks self-service reporting capabilities. Users with a creator license can duplicate existing dashboards, adjust filters or date ranges, and build new reports tailored to key performance indicators, such as portfolio performance, profitability metrics, or exposure by asset class. This empowers teams to make data-driven decisions based on the insights that matter most.
- Professional services: For teams without the resources to manage report creation internally, Built’s Professional Services team can act as an extension of your staff. They help scope, build, and deploy customized dashboards that align with your internal reporting cadence, risk management framework, and stakeholder requirements.
The Path to Proactive Portfolio Management
Ultimately, leveraging Built’s reporting suite moves your team beyond status updates and into strategic, real-time portfolio monitoring.
It gives financial institutions a centralized way to track project data, team performance, and enforce credit discipline, key factors in reducing exposure and protecting capital.
By applying these foundational practices, using the four core dashboards, and embracing automation through scheduled exports and alerts, you can create a data-driven framework for lower risk and stronger portfolio performance.
This approach supports informed investment decisions, improves stakeholder confidence, and unlocks scalable growth.
Start bookmarking your key views today and take the next step toward proactive portfolio management.
Book a demo with our team today.
Construction Loan Risk Dashboard FAQs
What metrics should a construction loan risk dashboard include?
A comprehensive construction loan risk dashboard should cover cost performance, schedule adherence, borrower health, draw activity, and project-specific risks such as contractor vetting and insurance coverage. These real-time metrics give lenders a single source of truth to monitor portfolio performance, spot potential issues early, and make informed decisions with confidence.
How does proactive portfolio monitoring improve loan performance?
Proactive monitoring allows financial institutions to mitigate risks before they escalate. By analyzing borrower behavior, credit health, and market trends, lenders can identify patterns, adjust exposure, and make data-driven decisions that support financial stability and growth. Built’s dashboards and alerts streamline this process through automated risk signals and portfolio-wide visibility.
How does Built help manage compliance and lien risk?
Built centralizes lien waiver tracking and compliance monitoring, reducing manual oversight and exposure to legal and financial risk. The platform can automatically alert teams if lien waivers are missing or if a compliance threshold is breached, enabling an active approach to protect assets, maintain trust with investors, and support due diligence across your lending operations.
