Built Answers: Proactive Portfolio Reporting and Data

Tell me if you’ve heard this story before: a chief lending officer or chief credit officer is asked to report on the overall health of their construction loan portfolio — best producing team members or loans, under-performing elements, effectiveness of the draw process, or some other key performance metrics.
While they know these metrics are vital to maintaining a profitable portfolio, they aren’t easily accessible. They have to manually pull data from several spreadsheets, triple checking formulas to ensure data is correct. Still, the numbers are days old at best, offering a past snapshot of what’s going on, even as their portfolio changes.
The officer and leadership team are frustrated. They feel like these reports should be working for them, not the other way around. They should help make better decisions in the future, instead of looking back at what just happened.
Question: How can my team manage all of the elements of our portfolio reporting to help us make better decisions?
At the core of this question is something more lenders are coming to terms with: We’re past the days of spreadsheets serving as our best option for real-time reporting and analytical decision making.
We all know that data has to be used today to make the decisions required to help our businesses succeed — not only to correct mistakes but to do more of what’s going right. But that data can’t be old or static, and it most definitely can’t be incorrect.
Unfortunately, traditional ways of loan performance reporting were all of those things. How do I know? Because here at Built we work with all of our clients to reconcile their core system with any spreadsheets or other data when they get onboarded to our system. That ensures what comes out is clean and accurate. And one of the most significant things I’ve seen: many lenders have difficulty reconciling their core with manual budgets during the course of construction, with some portfolios seeing 30-40% imbalance between the two.
That’s a huge issue for risk. But things don’t have to work that way.
Once clients are onboarded with us, regardless of integration to their core system, reporting is shown in real-time and accurate. It just works.
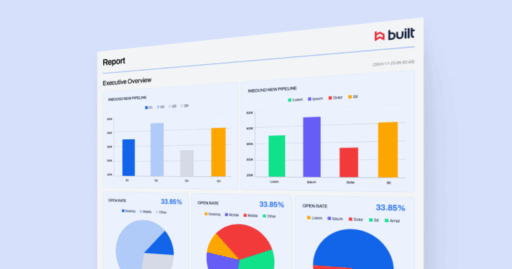
We also have two dashboard views that I think are a real benefit to the leadership team in the example above, offering a standardized and actionable report of the most important metrics on demand.
The Portfolio Overview – This offers a look at your portfolio’s overall health. Visualize things like types of loan projects across your entire portfolio so you can evaluate your overall risk and capacity, in aggregate and at a glance.
The Operational Dashboard – This lets you break down the constituent elements that can have a massive impact on your portfolio’s profitability and performance. Track project turn times to improve your draw process. Identify the employees, builders, products (perm-to-close vs. renovation loans), or vendors that create the most profit for your institution. Use meaningful data to make the operational decisions needed to keep ahead.
Together, these dashboards will give you what you need to cut risk and improve the profitability of your construction loan portfolio. If you want to take a look at how they work or have ideas for other data you’d like see in a report, get in touch with me. I’d love to help you out.


