State of the Nation’s Housing 2017 [Infographic]

Harvard’s Joint Center for Housing Studies released an extensive report on the state of the nation’s housing in 2017. We put the most salient of data points into an infographic for easy digesting and sharing.
The skinny: Ten years after The Great Recession, the national housing market is almost back to normal — prices are up near previous levels, along with housing demand and construction volumes, while homeowners in distress continues to fall. Things aren’t all rosy, though. Tight supply means affordability concerns for some. What does that tell us? Construction levels need to continue to increase to keep up with demand.
{{cta(‘a0c71649-280b-44ea-a8c1-2f3d3aeeca33’)}}
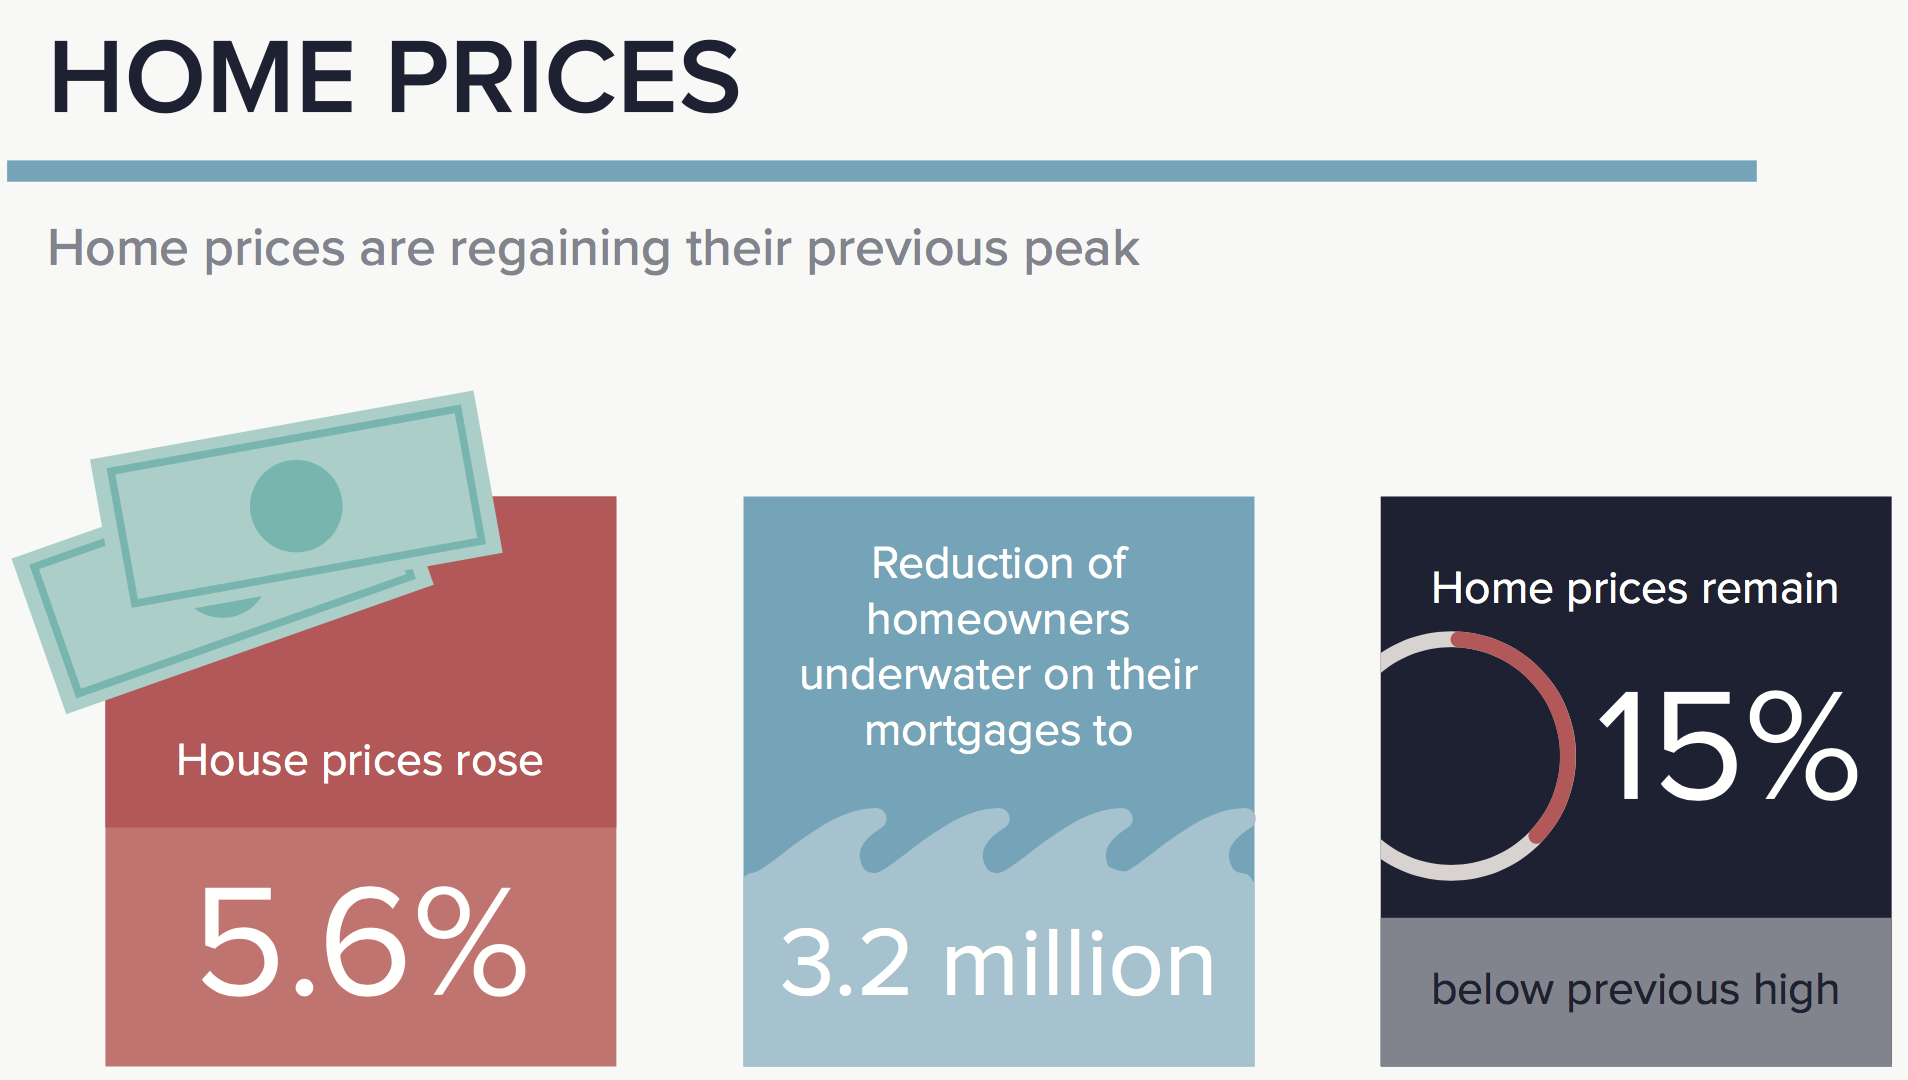
Home Prices
Home prices are regaining their previous peak.
- House prices rose 5.6% in 2016
- Households underwater on mortgages dropped to 3.2 million
- Home prices are still 15% below pre-recession highs
Construction Supply
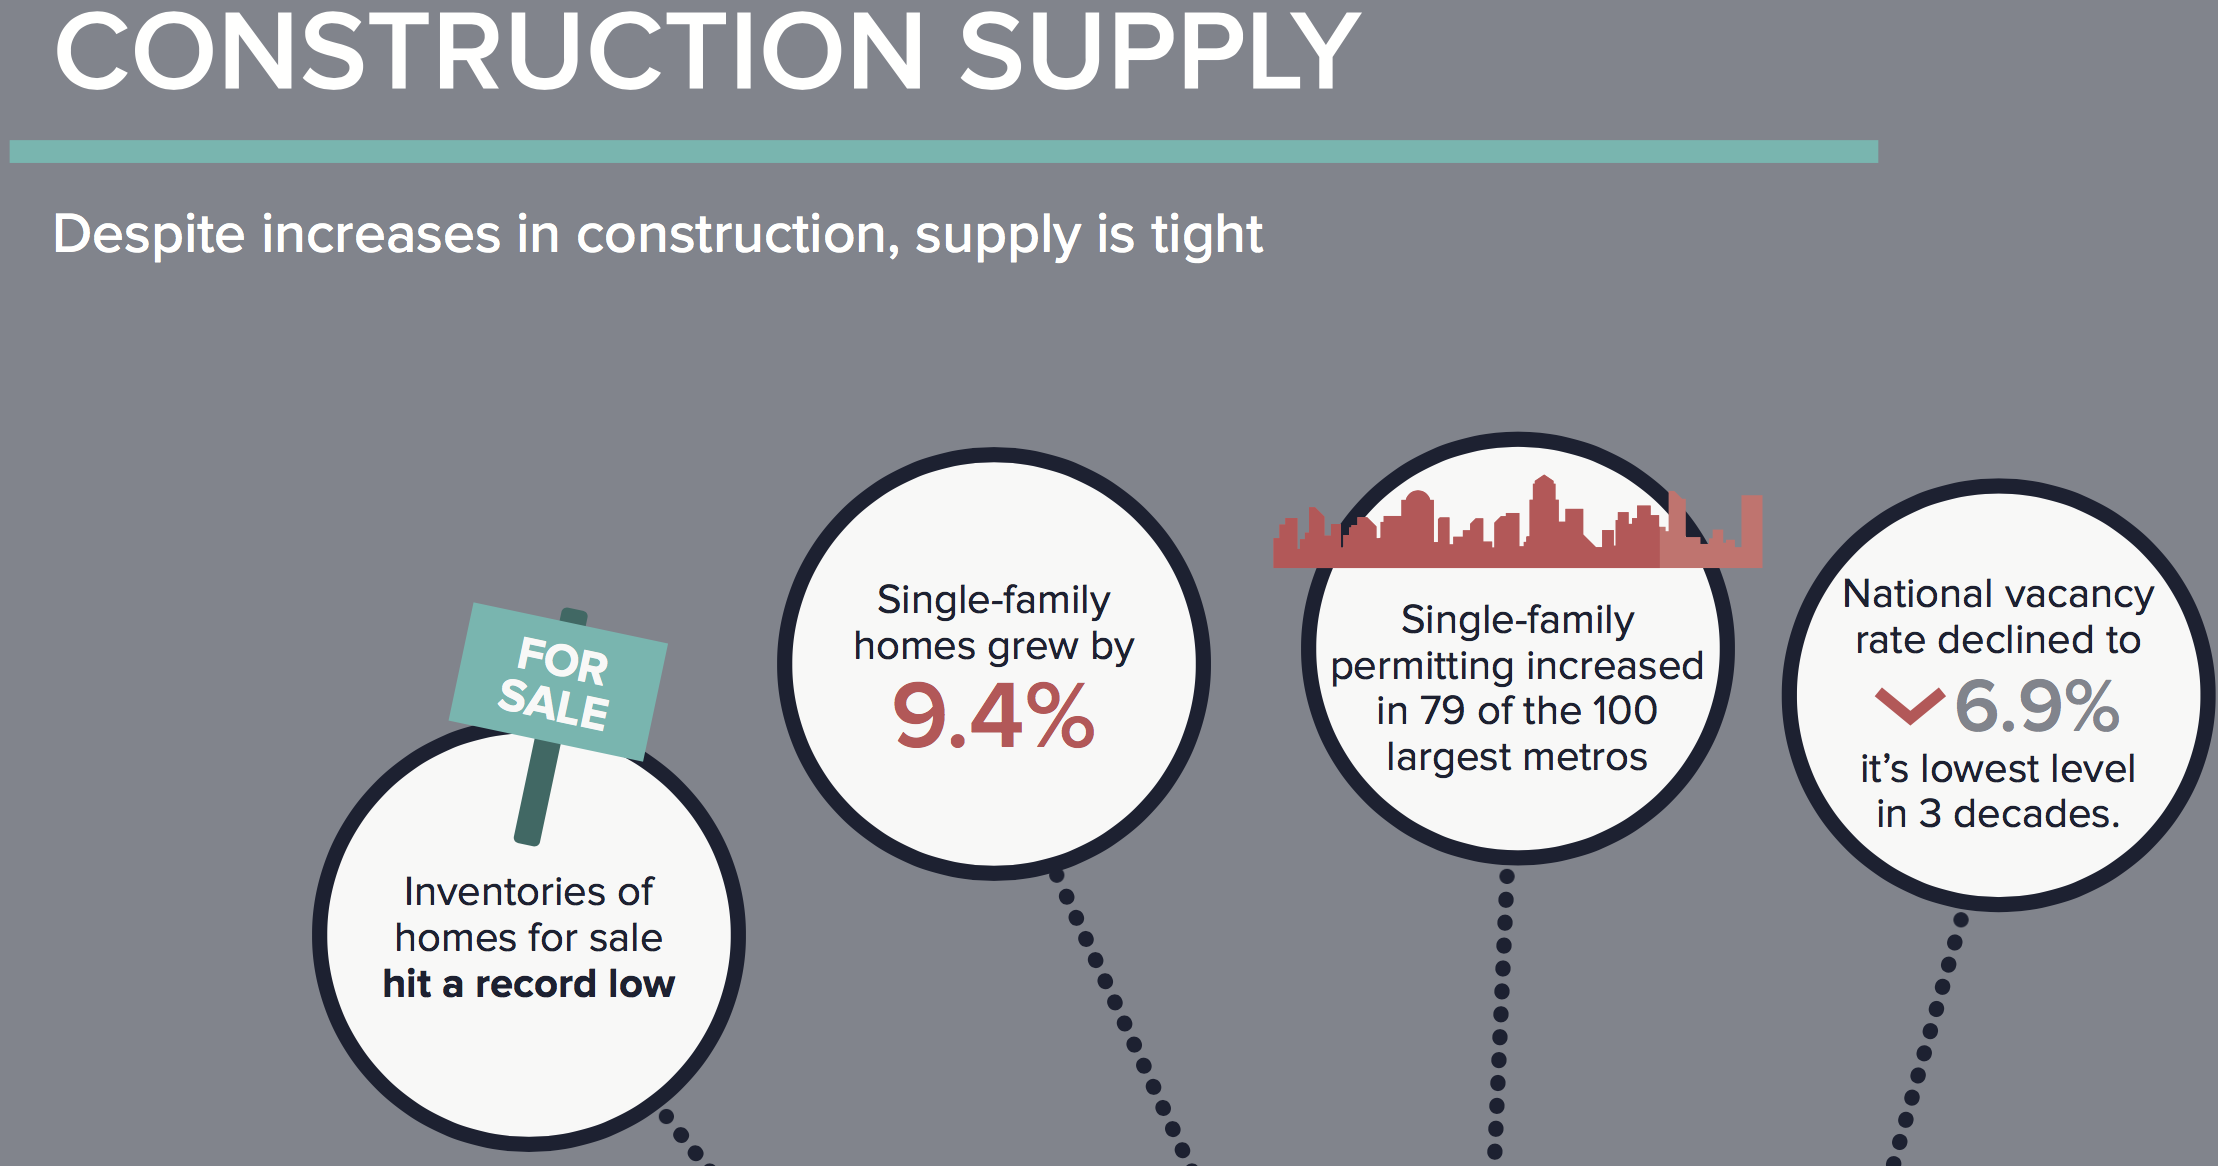
Despite increases in construction, supply is tight.
- Inventory of new homes for sale hit a record low
- National vacancy rate declined to 6.9%, the lowest level in 3 decades
- Housing starts increased by 5.6%
- Single family homes grew by 9.4%
- Single-family permitting increased in 79 of the 100 largest metros
- Construction of new multifamily units fell to 393,000
Rentals
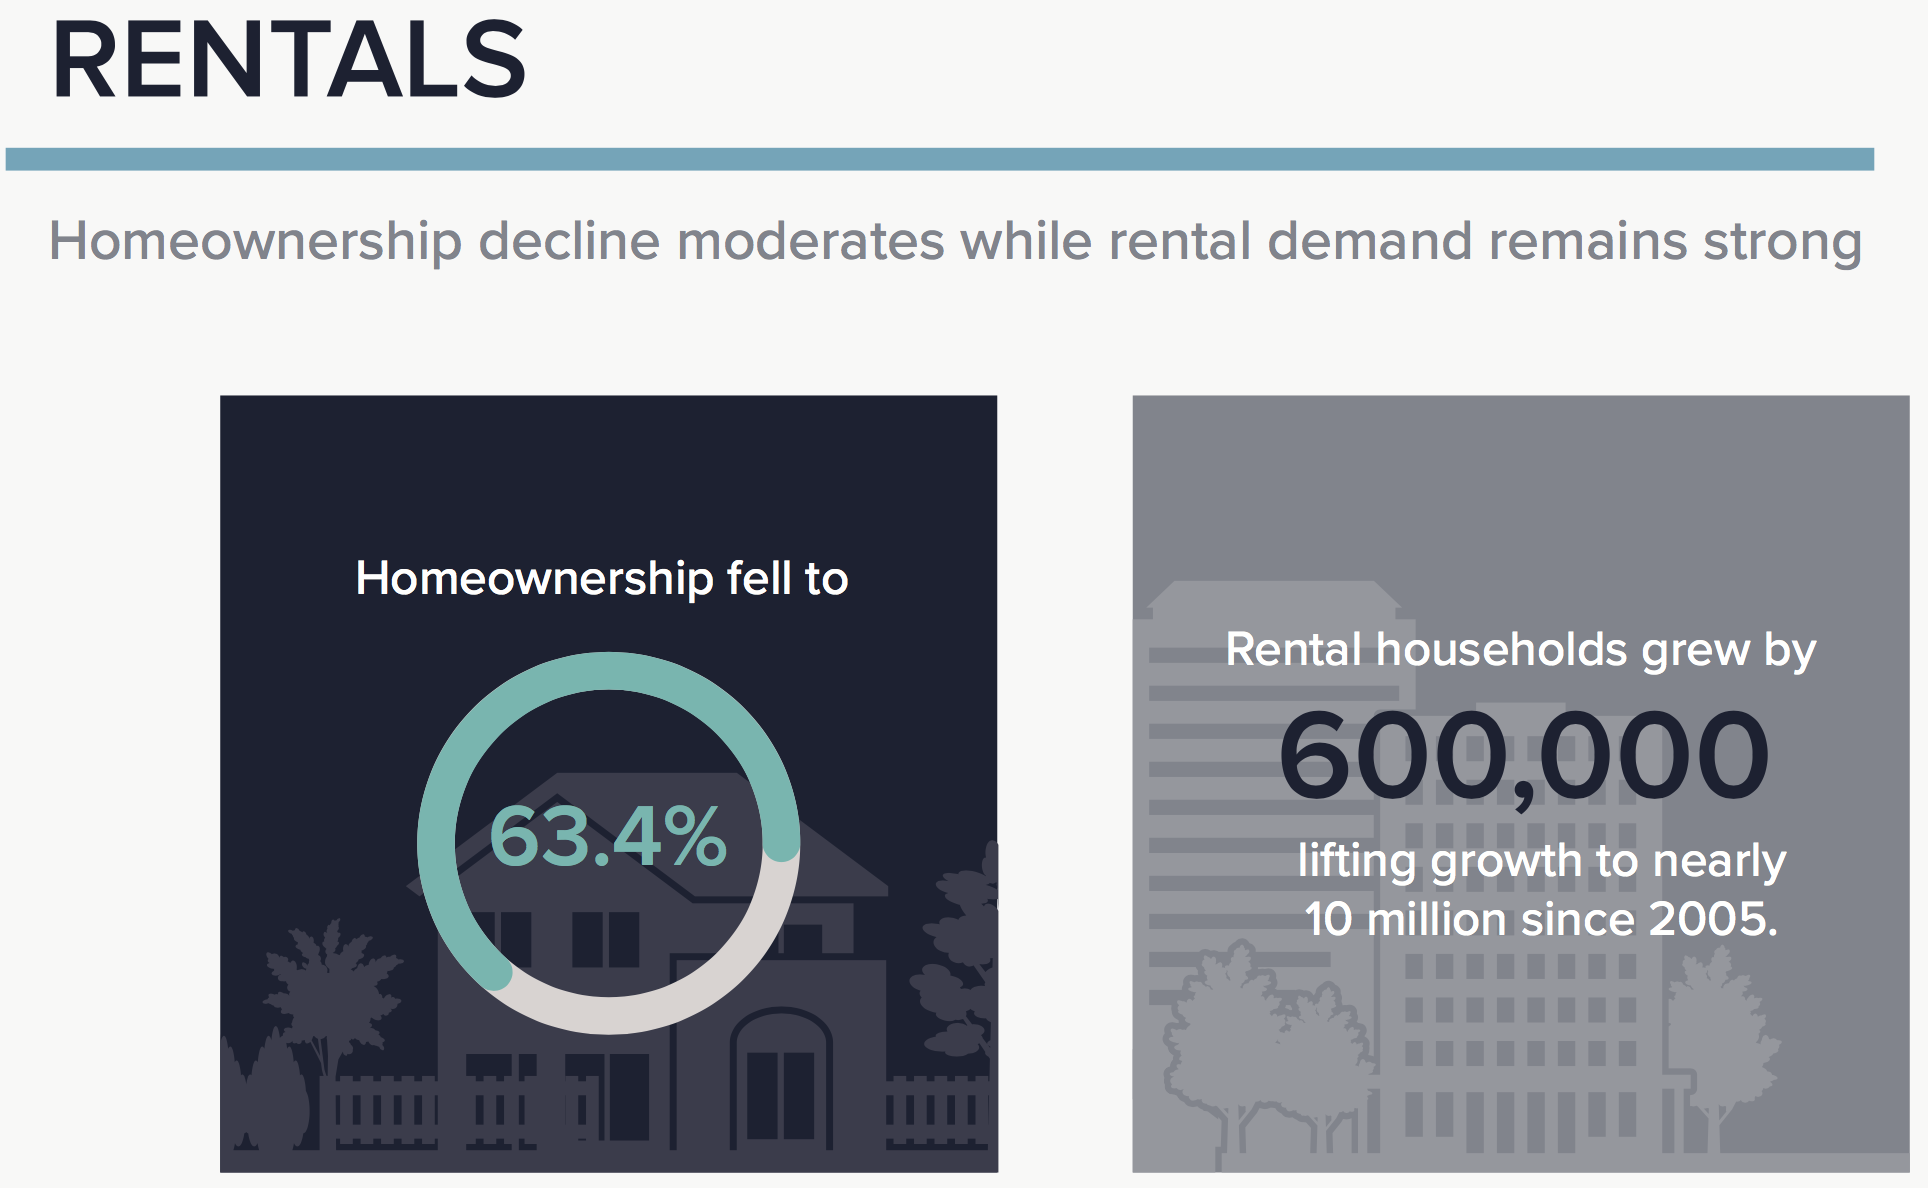
Homeownership decline moderates while rental demand remains strong.
- Homeownership fell to 63.4%
- Rental households grew by 600,000, lifting growth to nearly 10 million since 2005
Millennials, Immigrants and Older Americans
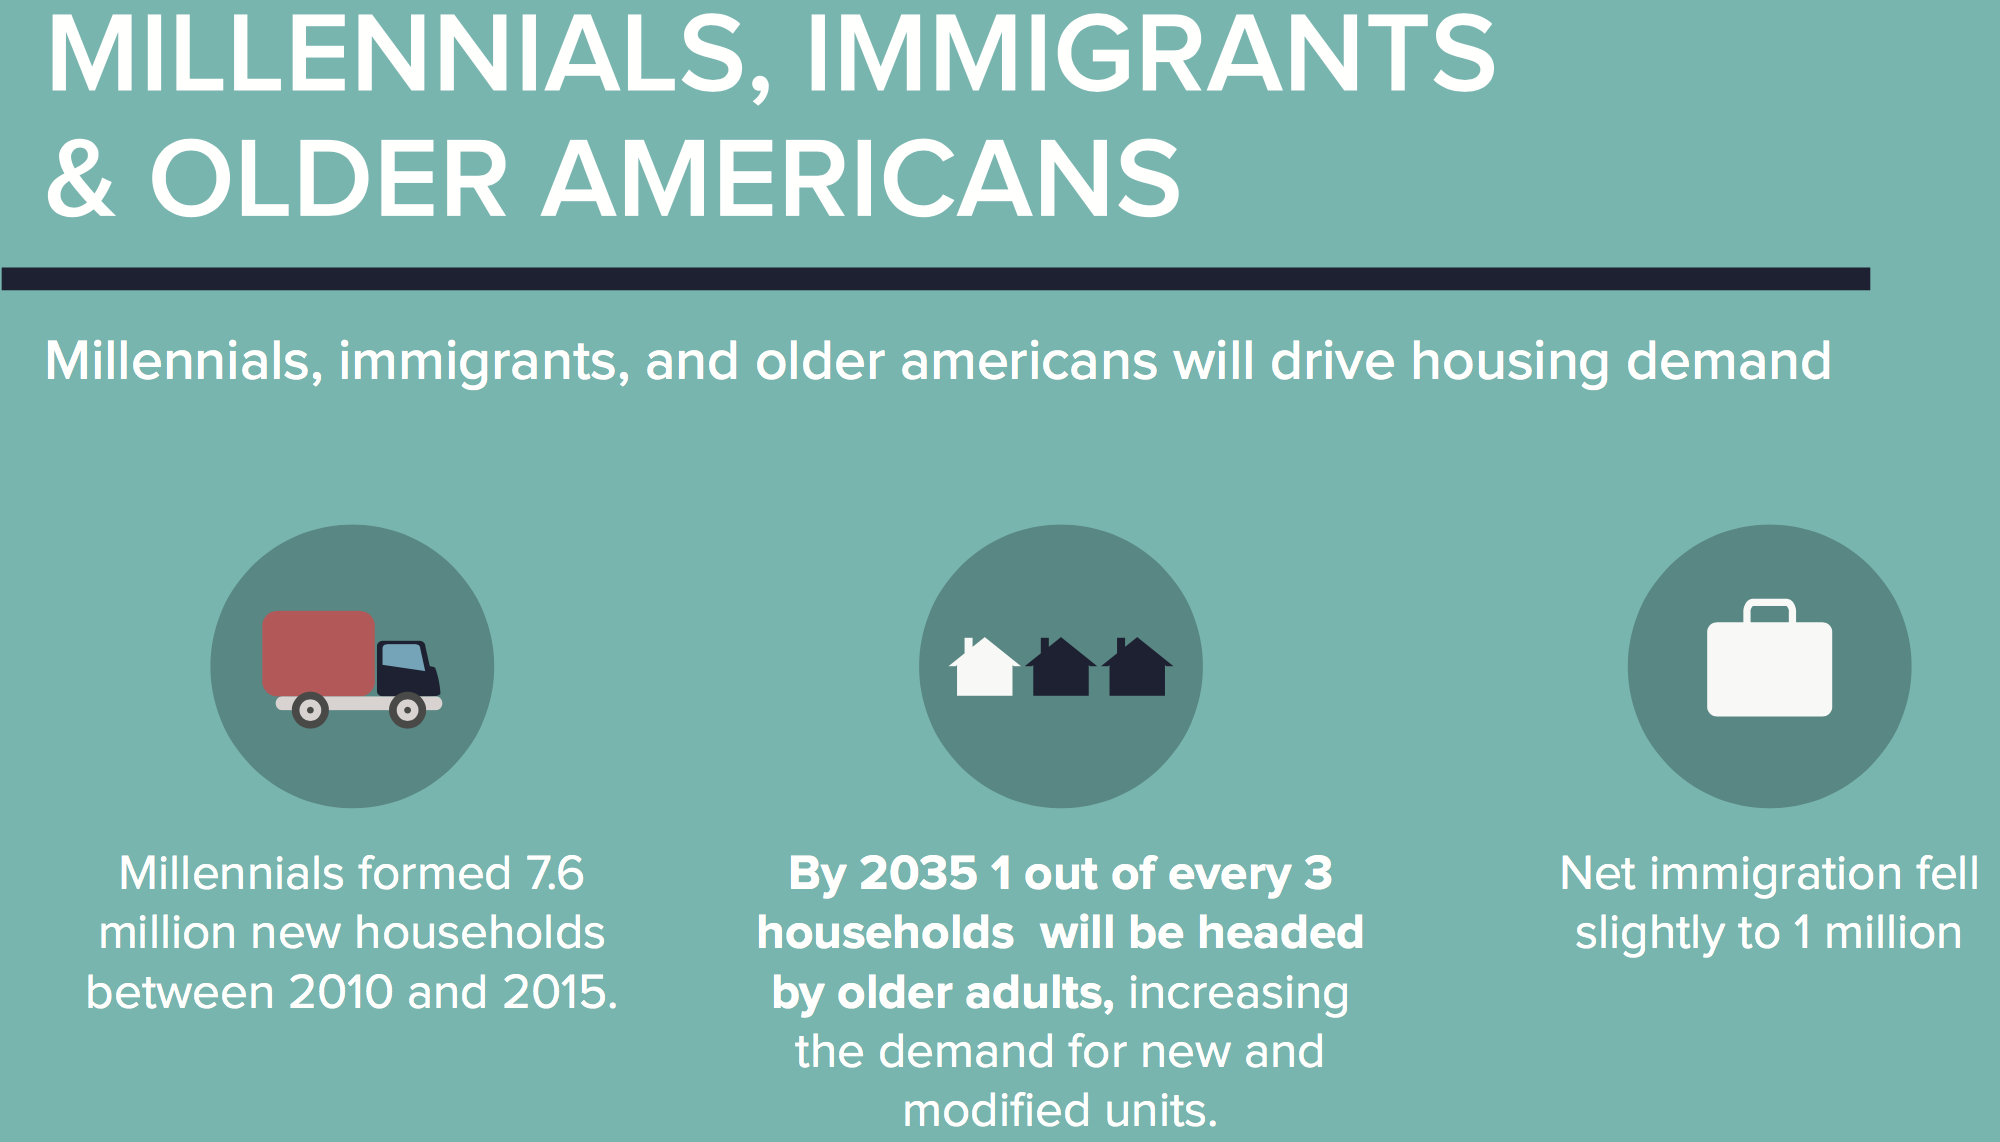
Millennials, immigrants and older americans will drive housing demand.
- Millennials formed 7.6 million new households between 2010 and 2015
- By 2035, 1 out of every 3 households will be headed by older adults, increasing the demand for new and modified units
- Net immigration fell slightly to 1 million
Poverty
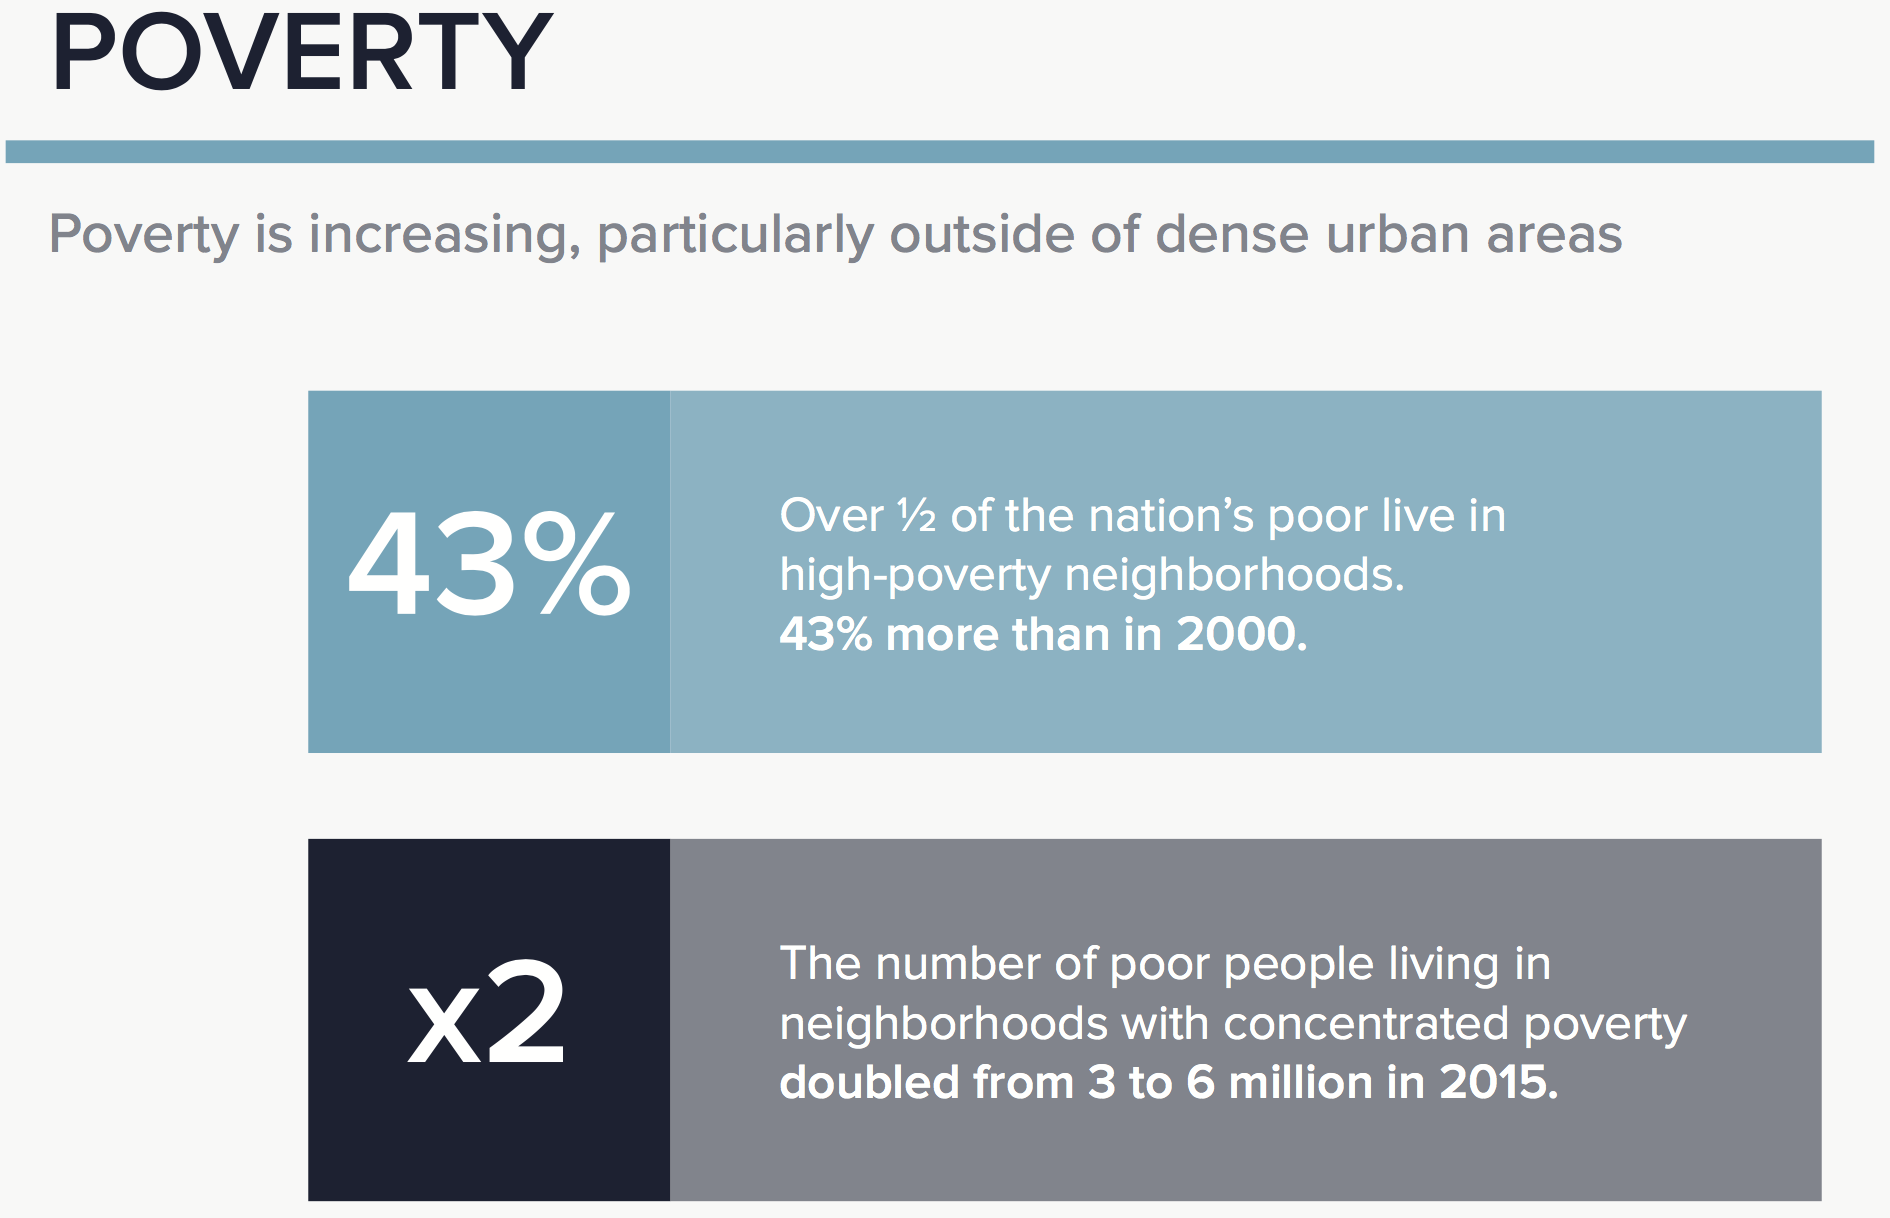
Poverty is increasing, particularly outside of dense urban areas.
- Over half of the nation’s poor live in high-poverty neighborhoods, 43% more than in 2000
- The number of poor people living in neighborhoods with concentrated poverty doubled from 3 to 6 million in 2015
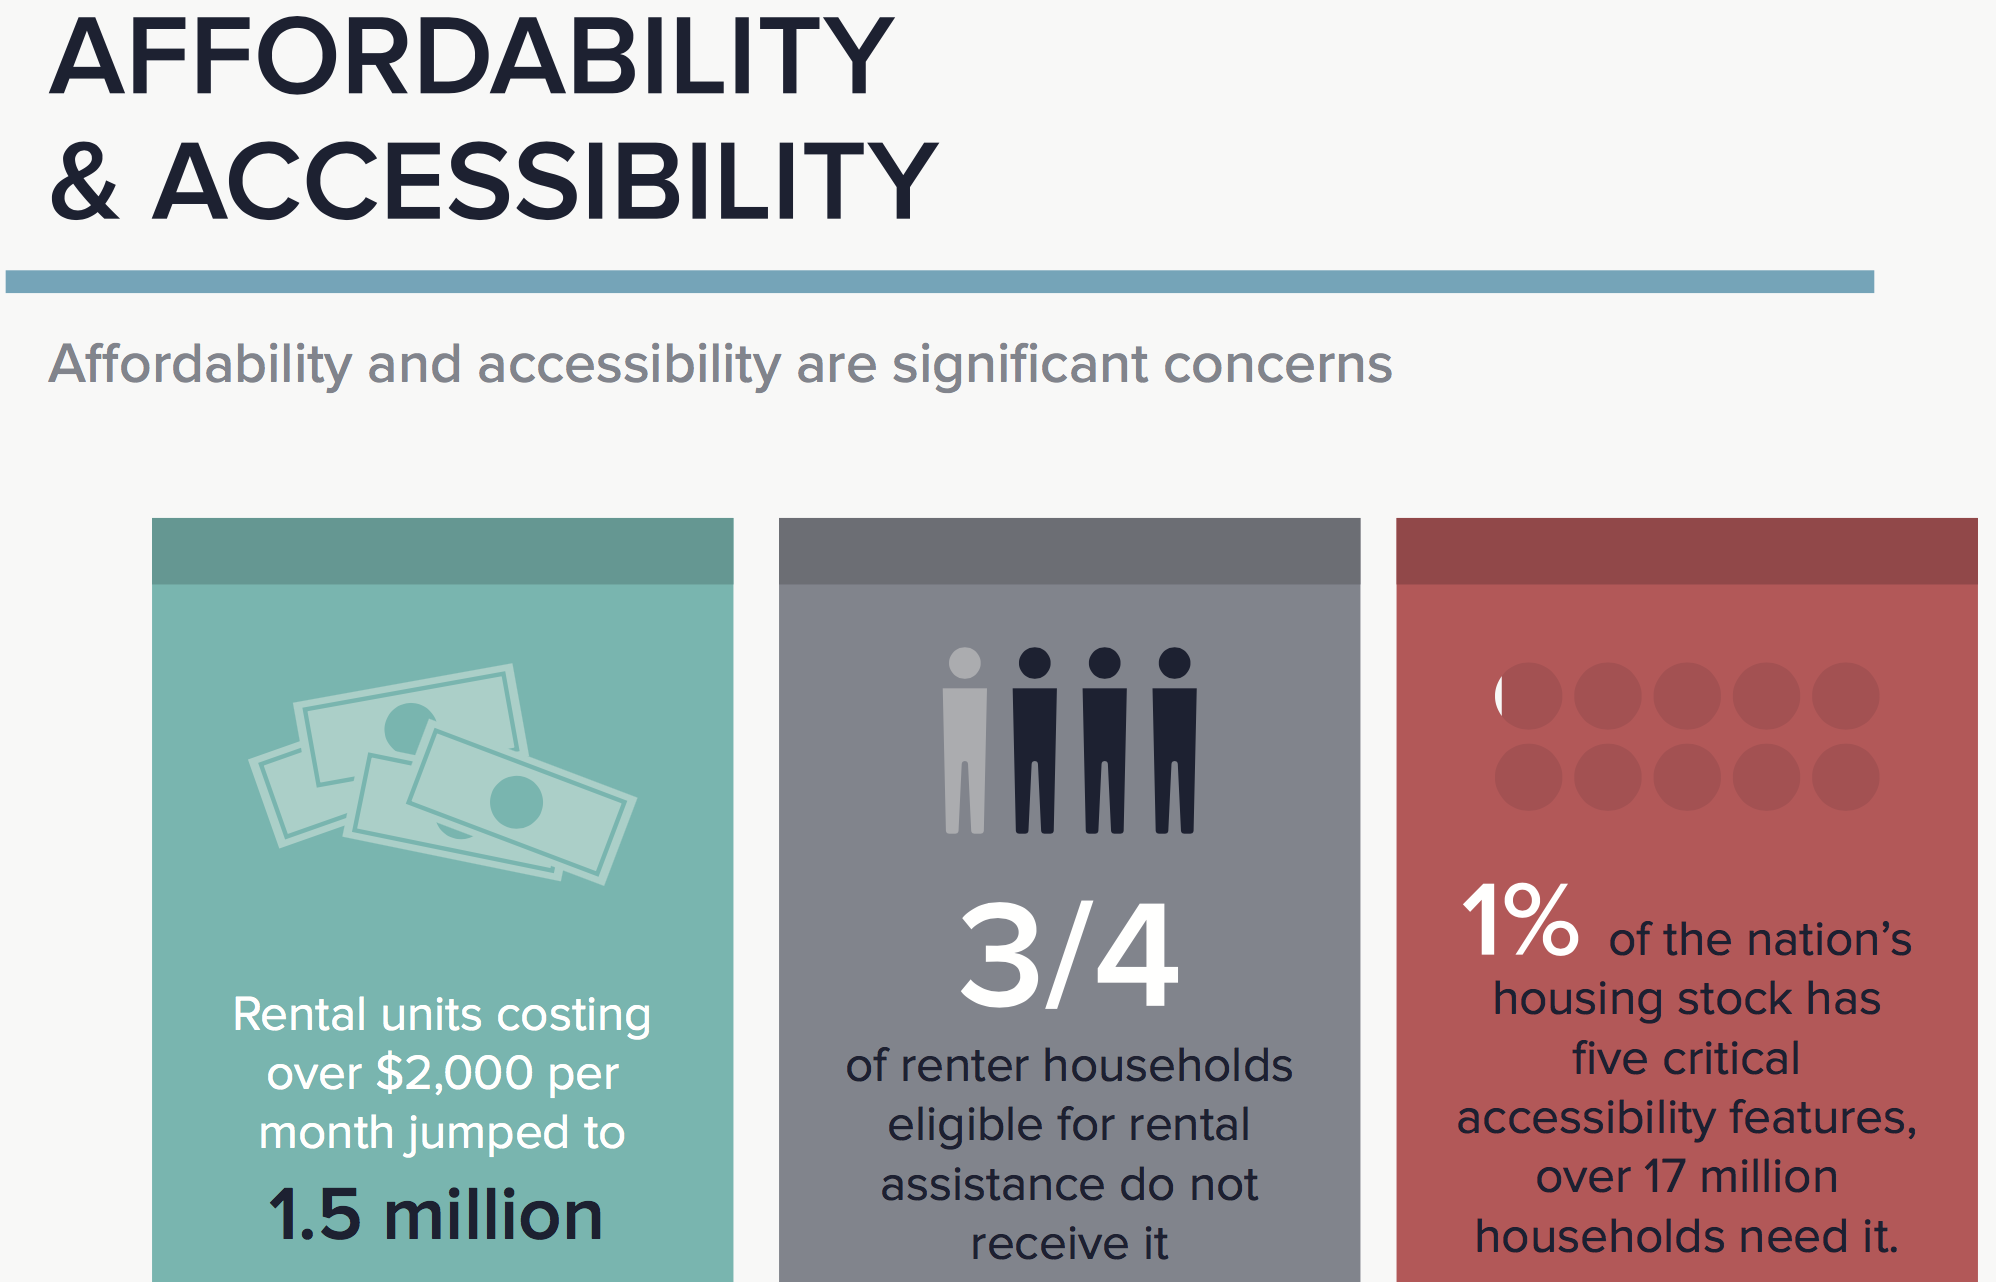
Affordability and Accessibility
Affordability and accessibility are significant concerns.
- Rental units costing over $2,000 per month jumped to 1.5 million
- ¾ of renter households eligible for rental assistance do not receive it
- 1% of the nation’s housing stock has five critical accessibility features; over 17 million households need it
{{cta(‘a0c71649-280b-44ea-a8c1-2f3d3aeeca33’)}}
